
ABOUT THIS PODCAST 🔗
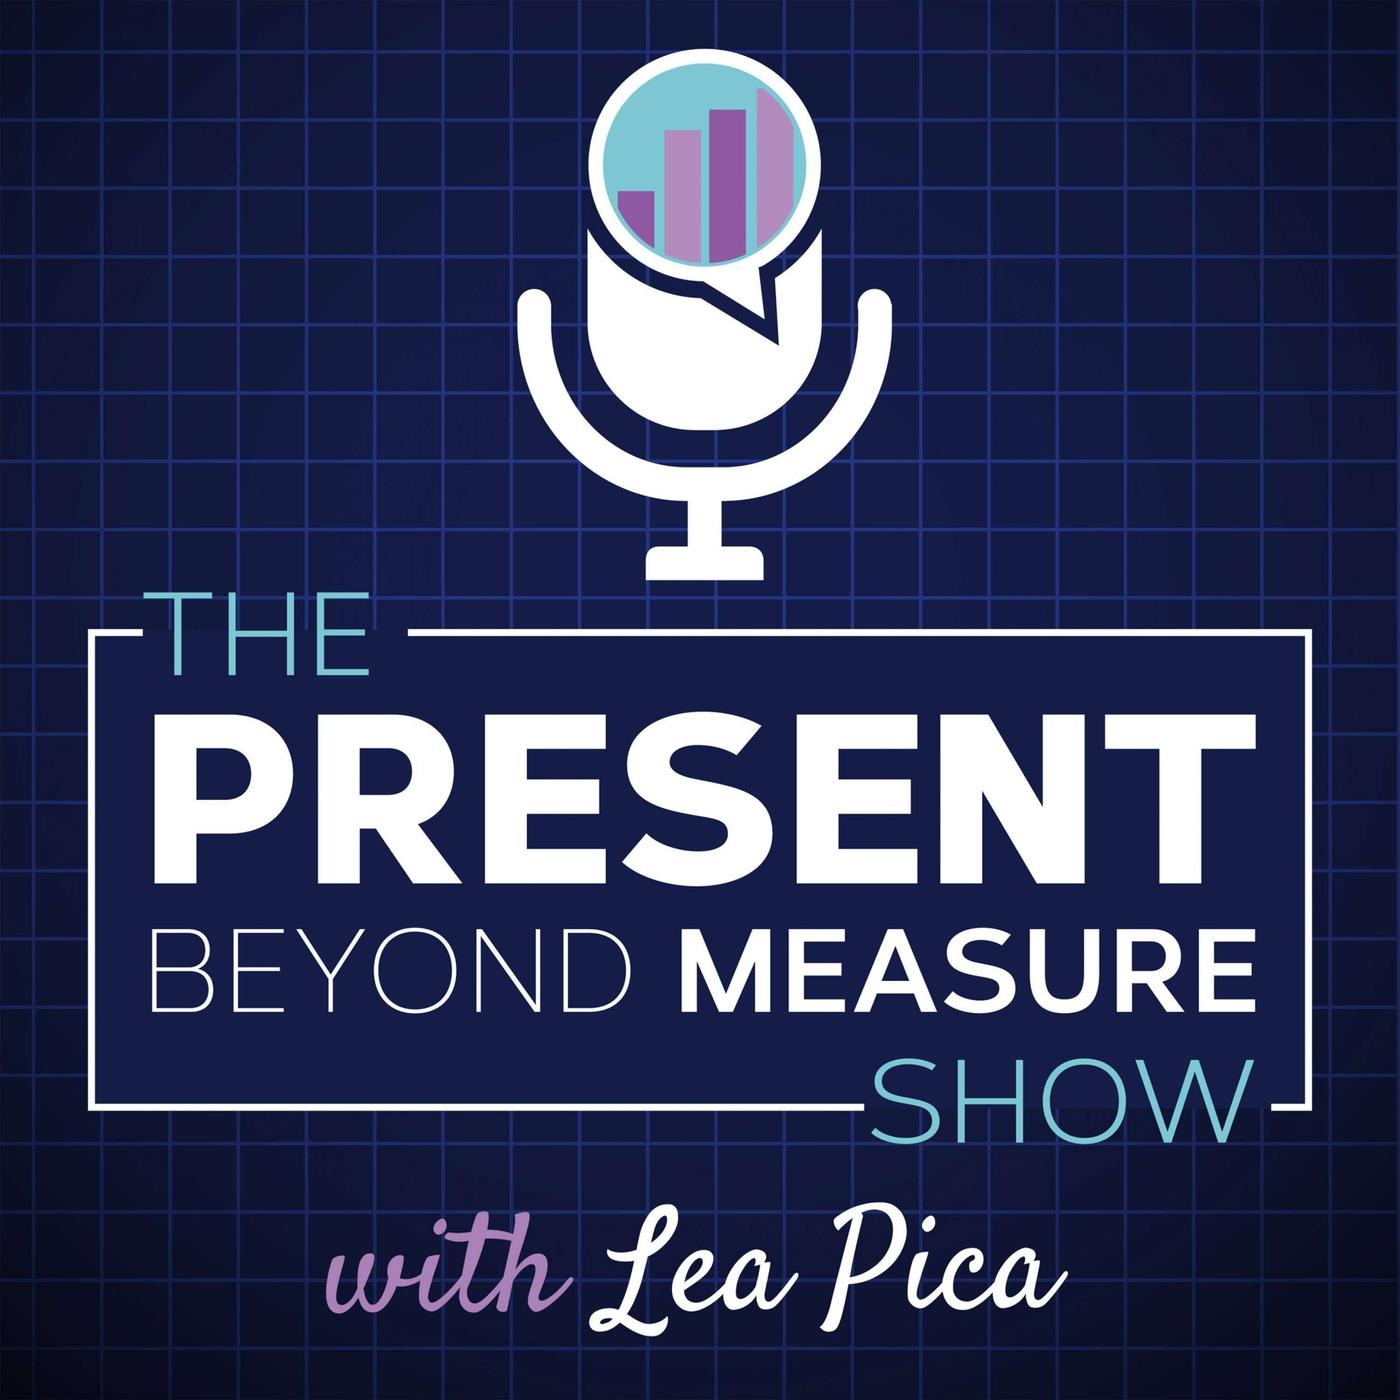
Your one-stop-shop for essential data storytelling, data visualization, and presentation skills for data analysts, digital marketers, data science, and data practitioners. With regular original content and luminary guest appearances from Nancy Duarte, Rand Fishkin, Alberto Cairo, Cole Nussbaumer Knaflic, Jim Sterne, Dustin Mathews, Garr Reynolds, and more. This is the toolset you need to present your insights, inform business decisions, inspire action, and become INDISPENSABLE.
Hosts:
Update frequency:
every 47 days
Average audio length:
52 minutes
Guest interviews
English
United States
85 episodes
since Aug. 12, 2015
episodic
IN THIS PODCAST 🔗
LATEST EPISODE 🔗
This episode is about harnessing the power of storytelling in your presentations and how AI is changing the data communication landscape. You’ll get a special two-in-one episode as our host Lea Pica, and guest, Richie Cotton, interview one another for their respective podcasts!
Join them as they …
SEARCH PAST EPISODES
Search past episodes of The Present Beyond Measure Show: Data Storytelling, Presentation & Visualization.
PREVIOUS EPISODES 🔗
Ever wonder what chart horizons lie beyond the basic bar, pie, or line graph? Jon Schwabish returns to the show to give us a tour of advanced chart options that can work well for business data storytelling and a few exotic graphs that are simply a fascinating and novel way to view data!
Jon is an …
What makes a stellar Google Data Studio dashboard? Michele Kiss has the answer. She is a recognised digital analytics leader, with expertise across web, mobile, and marketing analytics. She is a Senior Partner at Analytics Demystified, where she works with clients on analysis, training, and process…
This episode showcases another top-secret book snippet where I am sharing my top techniques and secrets for getting a business presentation audience to stay engaged, entertained, and enthused about your analytics and marketing insights.
I share the two most important questions I ask myself from my …
Jason Krantz is a LinkedIn data superstar on a mission to help data practitioners kick ass at their jobs using a widely underutilized tool in the analytics field: business literacy and personal growth.
>> VIEW SHOW NOTES + RESOURCES
In This Episode, You’ll Learn…
What is business literacy…
Today's guest is the one and only Kate Strachnyi, a meteorically rising star on the LinkedIn data circuit and appointed a LinkedIn Top Voice of Data Science & Analytics in 2018 & 2019.
We discover the mission behind her data media company, DATAcated, and her expert advice on how to overco…
Learn what the narrative arc is and how it can be used to supercharge your data storytelling presentation and impact.
>> VIEW SHOW NOTES + RESOURCES
Today’s guest is Kenny Soto (the only Kenny Soto that comes up on Google!), who joins us to share how he transitioned from music student to successful freelance digital marketing consultant and brand creator.
He discusses the importance of being able to explain data in a way that benefits the speci…
Dan Fraser is a presentation maven. He takes hard lessons from over 20 years of building and delivering dynamic presentations in government and the private sector - and hands them to you on a silver platter.
Dan uses his experience as a stand-up comedian to help instructors hone their ability to d…
Randy Krum, data viz extraordinaire, talks about the tyranny of the visualization default, the differences between data visualizations for discovery and communication, and why we shouldn't always use colors on everything!
He also talks about building on templates, the problems with numbers, and the…
Disclaimer: The podcast and artwork embedded on this page are from Lea Pica | Data Storytelling Advocate, Speaker + Educator, which is the property of its owner and not affiliated with or endorsed by Listen Notes, Inc.
PODCAST SEARCH ENGINE
You can use our website to search 3,837,021 podcasts and 197,800,325 episodes by people, places, or topics.

An investment in knowledge pays the best interest, so I listen to podcasts.
‐ Benjamin "Llamacorn" Franklin
SEARCH PAST EPISODES
Search past episodes of The Present Beyond Measure Show: Data Storytelling, Presentation & Visualization.
CLAIM THIS PODCAST
Why to claim podcasts?
If you are a podcaster, the best way to manage your podcasts on Listen Notes is by claiming your Listen Notes
podcast pages.
It is a great, free way to engage the podcast community and increase the visibility of your podcasts.
After claiming your Listen Notes podcast pages, you will be able to:
✓
Manually refresh the RSS feed to sync up
✓
Get a verified badge (
✓
) alongside with your podcast name on Listen Notes
✓
Post classified ads for sponsorship,
guests, co-hosts,
cross-promotion...
✓
Respond to listener comments on Listen Notes
✓
Use speech-to-text techniques to transcribe your show and
edit transcripts
✓
Improve the presence of your podcasts, e.g., self-service
podcaster interview...
✓
If you share your Listen Notes page and at-mention @ListenNotes
on X (formerly Twitter),
our official X (formerly Twitter) account will retweet to promote
your show to our followers.
Coming soon:
◯ Self-service promotion on Listen Notes
◯ Track your podcast stats on Listen
Notes, e.g., listens, page
views...
◯ Manage episodes
EDIT
Thank you for helping to keep the podcast database up to date.
