
इस एपिसोड के बारे में

Visualization is a very powerful cognitive tool. I think we all agree with that. But what happens if a person is visually impaired or has other impairments that prevent them to fully benefit from it? It’s surprising, despite the huge success visualization had during these last few years, how little we have to show in terms of supporting this very relevant segment of the population.
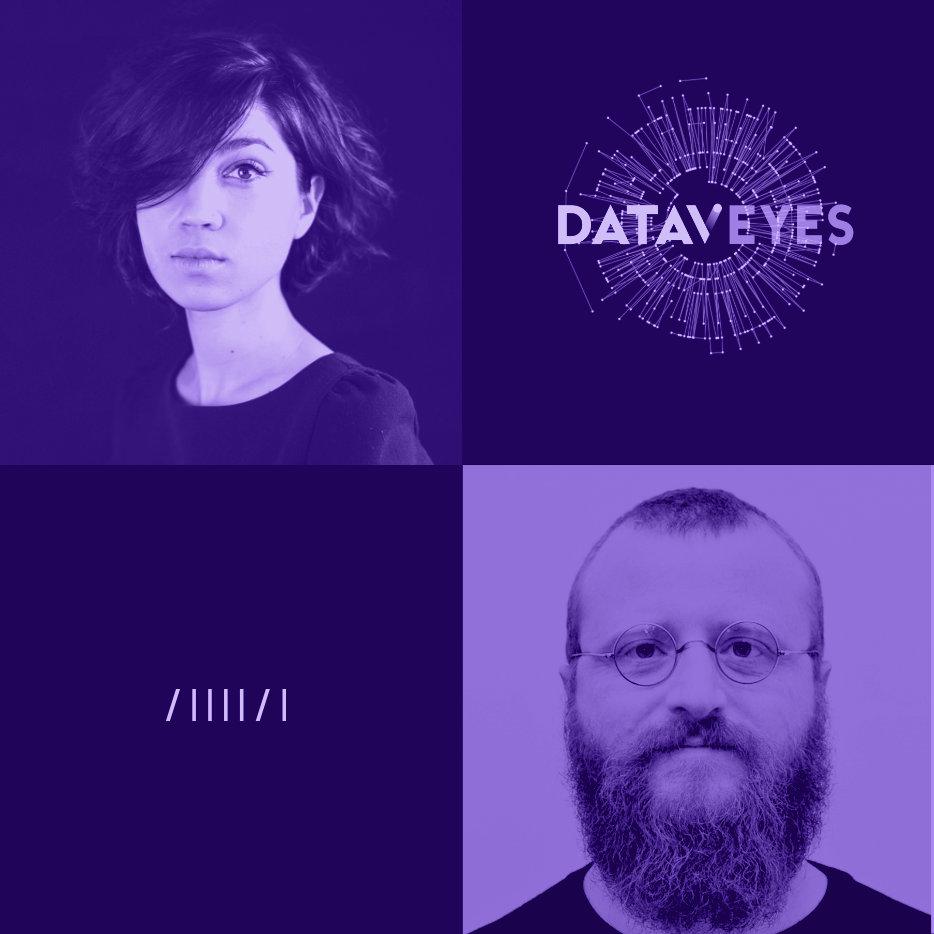
To discuss this topic we have on the show Sarah Fossheim. Sarah is a full-stack developer and UX researcher with a specific expertise on accessible design for data visualization projects. See for instance their “How to create a screen reader accessible graph like Apple’s with D3.js“.
On the show, we talk about what is accessibility and what role it plays in data visualization, how to make charts and visual representations more accessible, and how to get started with accessible design.
This is a hugely important topic and we hope you will find some inspiration by listening to it!
Links:
- https://fossheim.io
- https://twitter.com/liatrisbian
- Chartability <https://chartability.fizz.studio>
- Dataviz Accessibility Resources <https://github.com/dataviza11y/resources>
- Outlier 2021—Are your visualizations excluding ppl?
- Writing Alt Text for Data Visualization
- Apple previews powerful software updates designed for people with disabilities
- Summarizing Information Graphics Textually
- Loud Numbers Podcast
- DS 075 | Listening to Data From Space with Scott Hughes
—
Remember: our podcast is listener-supported, please consider making a donation! Using Patreon or Paypal. Thanks
Related episodes